NASA and NOAA confirm: June 2019 was the hottest June on record

What's Up In Climate Change? June tops all other records for heat and signs point to El Niño winding down
As meteorologist Mario Picazo reported just a few weeks ago, June 2019 was ranked as the warmest month of June on record, by the Copernicus Climate Change Service, which is part of the European Union's Copernicus Earth Observation Programme.
With all global records tallied, NASA, NOAA and the Japanese Meteorological Agency (JMA) have all added their own weight to this assessment.
According to all major climate monitoring programs in the world, it's official, June 2019 tops the climate record as the warmest month of June in the past 140 years!

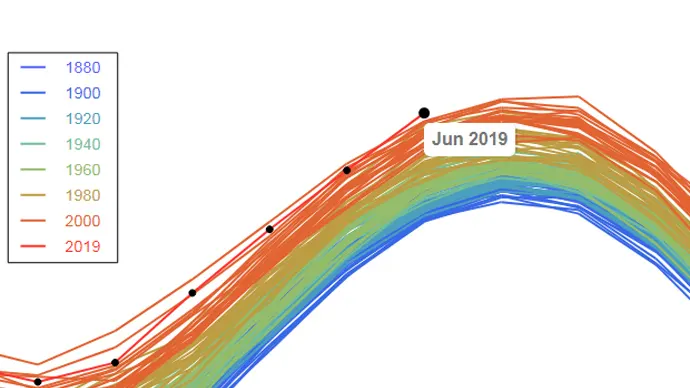
This graph shows the seasonal cycle of global temperature anomalies, from 1880 to 2019, compared with the 35-year global average temperature between the years 1980 and 2015. June 2019 tops all other months of June in the record books. Credit: NASA GISS
According to NASA's records, June 2019 was 2.08°C above the 1980-2015 average global annual mean, as shown in the graph, above. Note that half the months of the graph are above the average and half are below, tracking the seasonal cycle of the planet. Even though these are tallied from global records, the northern hemisphere seasons tend to dominate global tempertures, due to the larger abundance of land.
When compared to all other months of June in the record, NASA's records show that June 2019 was 0.95°C above the 20th century average.
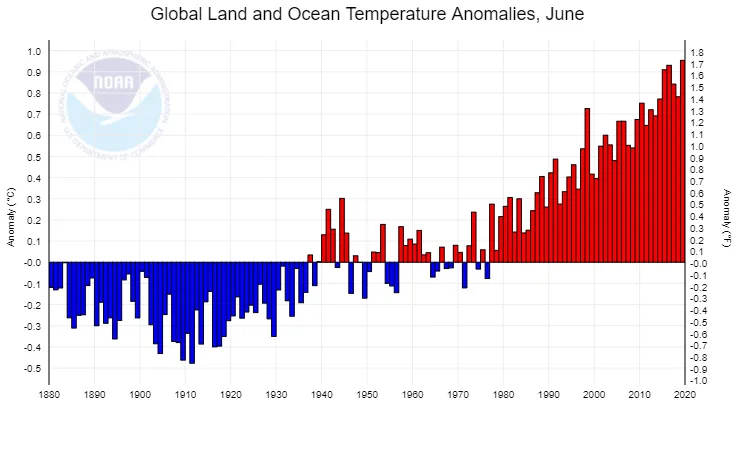
NOAA's tally of all June monthly temperatures, from 1880 to 2019. June 2019 ranks as the hottest, globally, over land and sea. Credit: NCDC/NOAA
According to NOAA, they agree with NASA, with June 2019 coming in as 0.95°C above the 20th century average, besting the previous record set in 2016 by 0.02°C.
Based on NOAA's records, nine of the 10 warmest Junes have occurred since 2010.
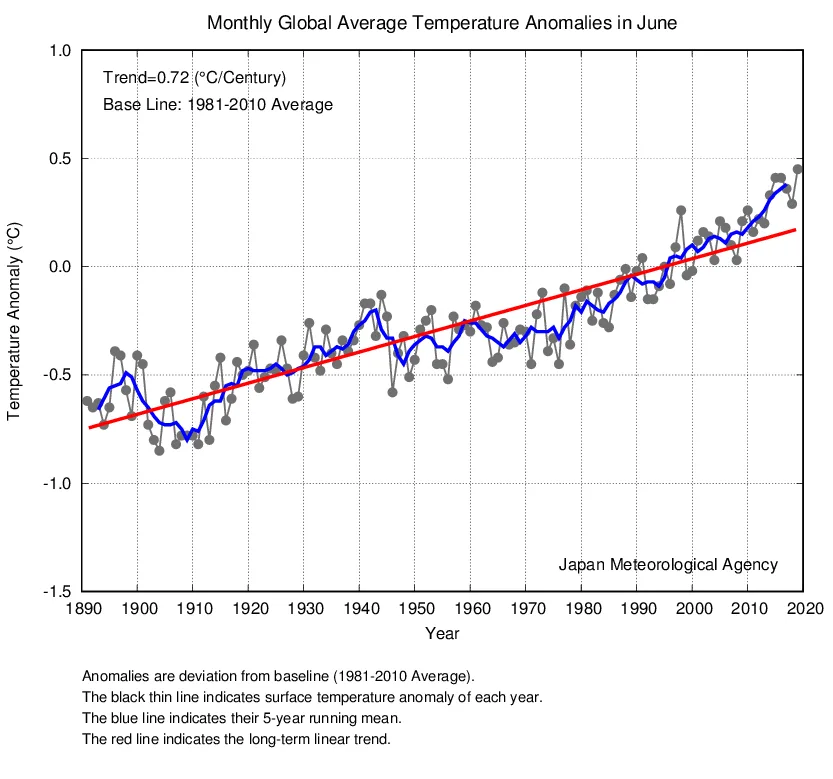
Graph of global temperatures for the month of June, from 1890 to 2019. June 2019 is the warmest. Credit: JMA
Although the Japan Meteorological Agency's graph, above, compares temperatures to a different base average than NASA and NOAA - from 1981 to 2010 instead of the entire 20th century - June 2019 still ranks as the warmest month of June on record. According to the graph, it was 0.45°C above the 1981-2010 average, but according to JMA's website, that equates to 0.80°C above the 20th century average.
Why the difference? As global temperatures have continued to rise, it was warmer on average, between 1981-2010, compared to the entire 20th century, so comparing current temperatures to that more-recent 30 year average.
EL NINO SET TO WIND DOWN
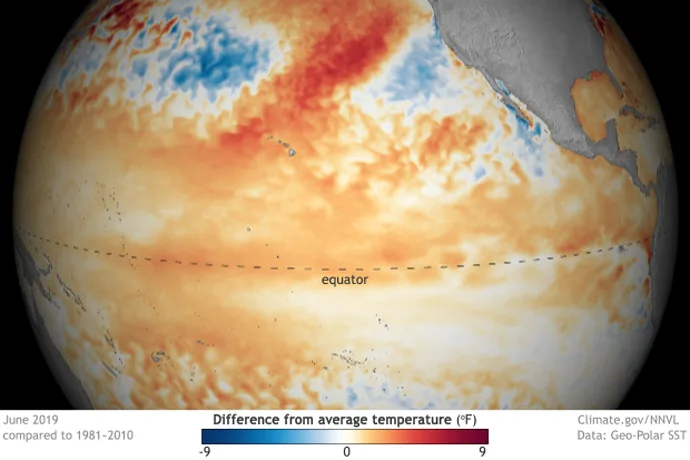
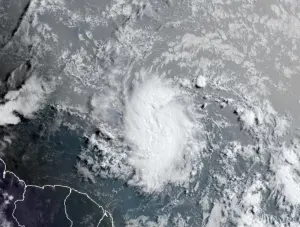
The heat across the equatorial Pacific Ocean, for June 2019. Credit: Climate.gov
According to NOAA's Climate Prediction Center, although an El Niño Advisory is still in effect, meaning that sea surface temperatures across the equatorial Pacific Ocean are still warmer than 0.5°C above normal, forecasters are seeing signs that this year's pattern is likely winding down.
This plot shows subsurface temperatures at the equator, across the Pacific Ocean, averaged over each 5-day period, between June 2-July 2, 2019. Credit: Climate.gov
As the animation above shows, the warming along the coasts of Ecuador and Peru, as well as the large blob of heat across the central Pacific, have been dissapating throughout the month of June.
According to Climate.gov's Emily Becker, in what is probably the first-ever Monty Python-themed analysis of El Niño: "Overall, the heat content in the top 300 meters of the equatorial Pacific is just about average now, in early July. This is one of the major factors in our forecast for a return to near-average surface temperatures and neutral ENSO conditions. Once the surface temperatures return to average, and the source of extra heat to the air above the central Pacific is gone, the atmospheric component of El Niño — that weakened Walker circulation — will also return to average."

Modelling of the current situation in the equatorial Pacific reveals a trend back towards neutral conditions (neither El Niño nor La Niña) for the months ahead. Credit: Climate.gov
Something of interest to note: While the above graph shows us returning to neutral conditions in the months ahead, there is actually a slight uptick back towards El Niño conditions indicated for the coming winter. As Becker mentions, this trend is also seen in other models, so it's likely not just a fluke.
The reason for it? As Becker explains, it's due to the amount of warm water under the ocean's surface just south of the equator.
"The significance of the presence of warm water here is that the average subsurface ocean currents will tend to carry this warmth northward toward the equator over several months, potentially providing more warm water to the equatorial regions," Becker wrote. "In turn, more warm water under the surface at the equator could potentially influence the surface, making El Niño and neutral more likely than La Niña."
Sources: NASA | NOAA | JMA | NOAA Climate.gov