After record-hot October, global heat just breached 2 degrees for the first time

Last month added yet another extreme to 2023, but a mid-November temperature spike exceeded a worrisome global climate milestone.
As the fifth record-breaking month in a row this year, October ticked several boxes among climate records. However, as of mid-November, global temperatures appear to have exceeded a major climate threshold for the very first time.
NOAA, NASA, the Copernicus Climate Change Service, and the Japanese Meteorological Agency are all in agreement about last month. No matter which method they used to computer the global average, which data set they favour, or how far back their records go, October 2023 was — by far — the warmest month of October they've ever recorded for the planet.

October 2023 global temperature anomaly graphs from NASA (top left), Copernicus (top right), NOAA (bottom left), and JMA (bottom right) reveal the surprising heat seen during the month compared to previous years. Credits: NASA, NOAA, JMA, Copernicus; composite by Scott Sutherland
According to NOAA: "Last month was also 2023's fifth month in a row of record-warm global temperatures."
"For the seventh-consecutive month, global ocean surface temperature also set a record high," they added. "Last month was the 47th-consecutive October and the 536th-consecutive month with global temperatures above the 20th-century average. The past 10 Octobers (2014–2023) have all been the warmest Octobers in NOAA's global climate record."
Additionally, according to the U.S. National Snow and Ice Data Center (NSIDC), Antarctic sea ice extent set a sixth consecutive monthly record low in October. Combined with the seventh smallest extent for Arctic sea ice, NOAA says the combined global sea ice extent was the lowest ever seen for the month.
Overall, after adding October to the tally for 2023, NOAA's analysis rates it as virtually certain (greater than 99.5 per cent chance) that this year will end as the next hottest year on record.
READ MORE: How have emissions contributed to the current heat records?
As of the end of October, NOAA's latest assessment showed that we are now in a 'strong' El Niño event. This occurs when the agency's Oceanic Niño Index (ONI) — the 3-month average sea surface temperature across the central equatorial Pacific — reaches at least +1.5°C above average. An ONI value of +0.5°C is the threshold for an El Niño event to be in effect. So far, the strongest event on record was in 2015-2016, where the ONI reached an extreme of +2.6°C.

Ocean temperatures across the equatorial Pacific are plotted here, showing the status of El Niño, with extremely warm waters off the coast of Ecuador. Credit: NOAA Climate.gov
As we saw during previous events, the current El Niño is adding extra heat to Earth's climate, pushing global temperatures higher than they would be in its absence. It's not yet clear exactly how much of the year's heat can be attributed to it, though. At the end of 2016, NASA scientists estimated that El Niño had contributed roughly one-tenth of a degree to that year's record-setting 0.99°C annual average temperature.
However, even as the current El Niño was just getting started, some unprecedented extremes were recorded in both sea surface temperatures and global surface temperatures.
READ MORE: 2023 could be the first year to exceed a global climate threshold
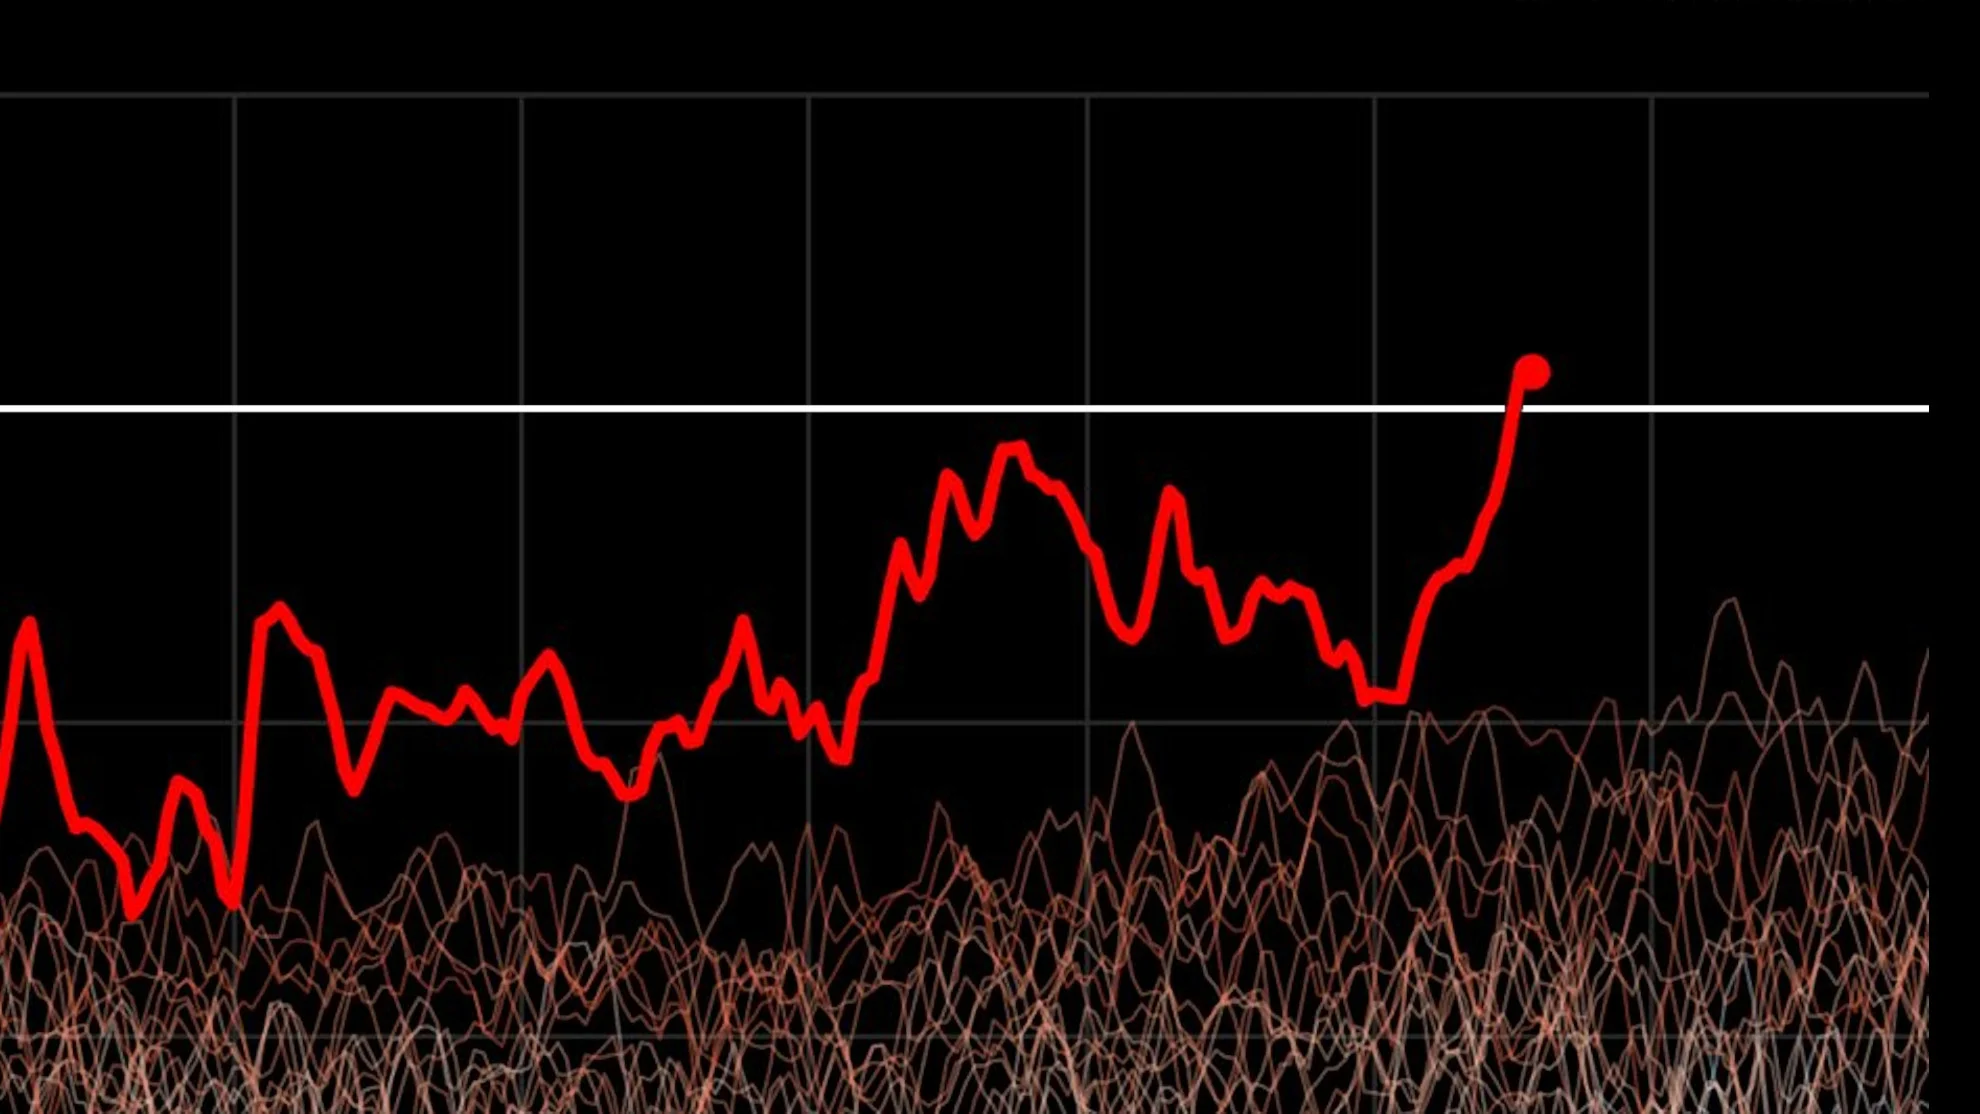
The latest showed up on November 17 and 18, when Copernicus' records revealed that daily global surface air temperature anomalies had exceeded +2°C above the average pre-industrial temperature from 1850-1900. This is the first time we have ever seen global temperature anomalies climb that high.

This graph plots daily global average surface air temperatures from the 1940s through 2023, so far. On November 17, the temperature anomaly reached +2.07°C above pre-industrial, while on November 18, it was +2.08°C. Comparison with 1850-1900 represents the cumulative impacts of global warming, as it uses a baseline temperature set before fossil fuel emissions began to significantly warm the planet. Credit: Copernicus Climate Change Service
"The ERA5 record now contains two days where global temperatures exceed the pre-industrial level by more than 2°C. That this should happen in the same month that world leaders will gather to take stock of progress towards meeting Paris Agreement commitments at COP28 sends a very clear message — the time for definitive action to tackle climate change is now," Carlo Buontempo, the director of the Copernicus Climate Change Service, said in a press release.
"While exceeding the 2°C threshold for a number of days does not mean that we have breached the Paris Agreement targets, the more often that we exceed this threshold, the more serious the cumulative effects of these breaches will become," Buontempo explained.
The 2015 Paris Agreement defined +2°C above pre-industrial levels as the upper limit to global warming the world's governments should strive for to prevent catastrophic climate disasters. A more 'optimistic' limit of +1.5°C was also set, which would save many island nations from sinking beneath the ocean's surface. These limits referred to a permanent state, though, where annual global average temperatures would rise above those thresholds and stay there for the foreseeable future.
These extreme temperatures in the Copernicus data only represent a temporary breach of the +2°C threshold. However, as Berkeley Earth climate scientist Zeke Hausfather said, "it's a worrying sign."
(Thumbnail image courtesy Copernicus Climate Change Service)