Satellites reveal Earth's ice is melting away at a record rate

"The ice sheets are now following the worst-case climate warming scenarios," says one researcher.
The first global satellite survey of ice-loss has shown that the shrinking of Earth's ice sheets and glaciers is now at a record rate, and it is accelerating.
As our planet warms, increasing air and ocean temperatures are taking their toll on the planet's vast stores of ice. Arctic sea ice is melting away to its lowest extent seen in decades. Ice shelves surrounding Antarctica are being eroded by warming ocean waters from below. The ice sheets of Antarctica and Greenland are shrinking, and the roughly 200,000 glaciers around the world are in rapid retreat.
Taking a global survey of these losses via satellite, a new study has found that between 1994 and 2017, the planet has lost nearly 28 trillion metric tons of ice.
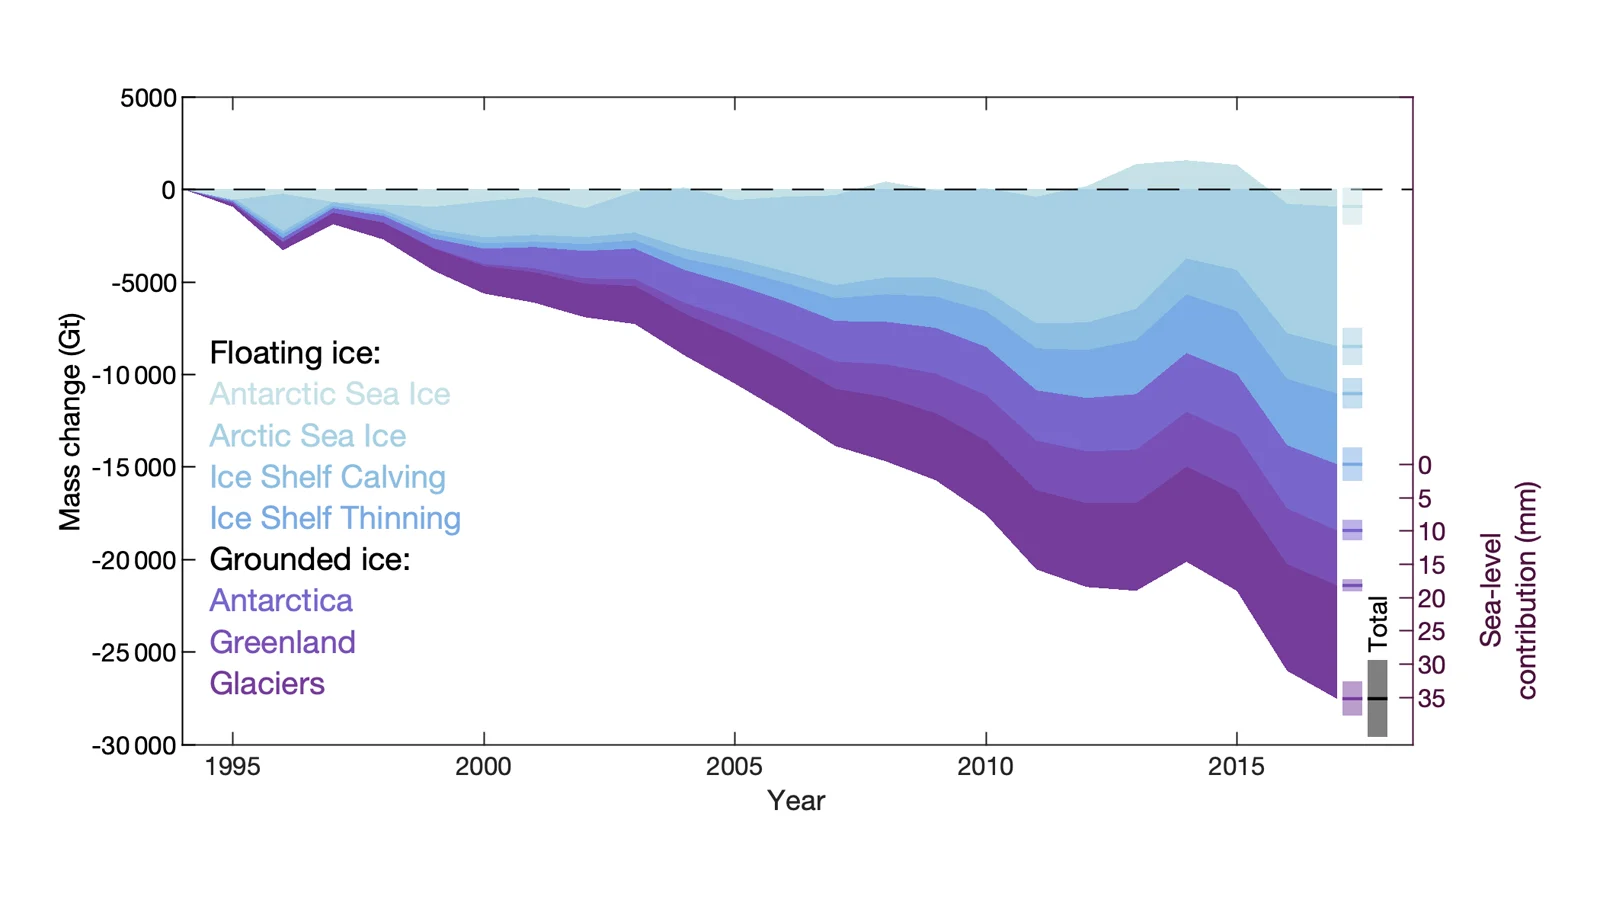
This graphic shows the relative share of ice loss between Antarctic and Arctic sea ice, Antarctic ice shelves and ice sheets, Greenland's ice sheet, and the world's glaciers. Credit: Centre for Polar Observation and Modelling (CPOM)
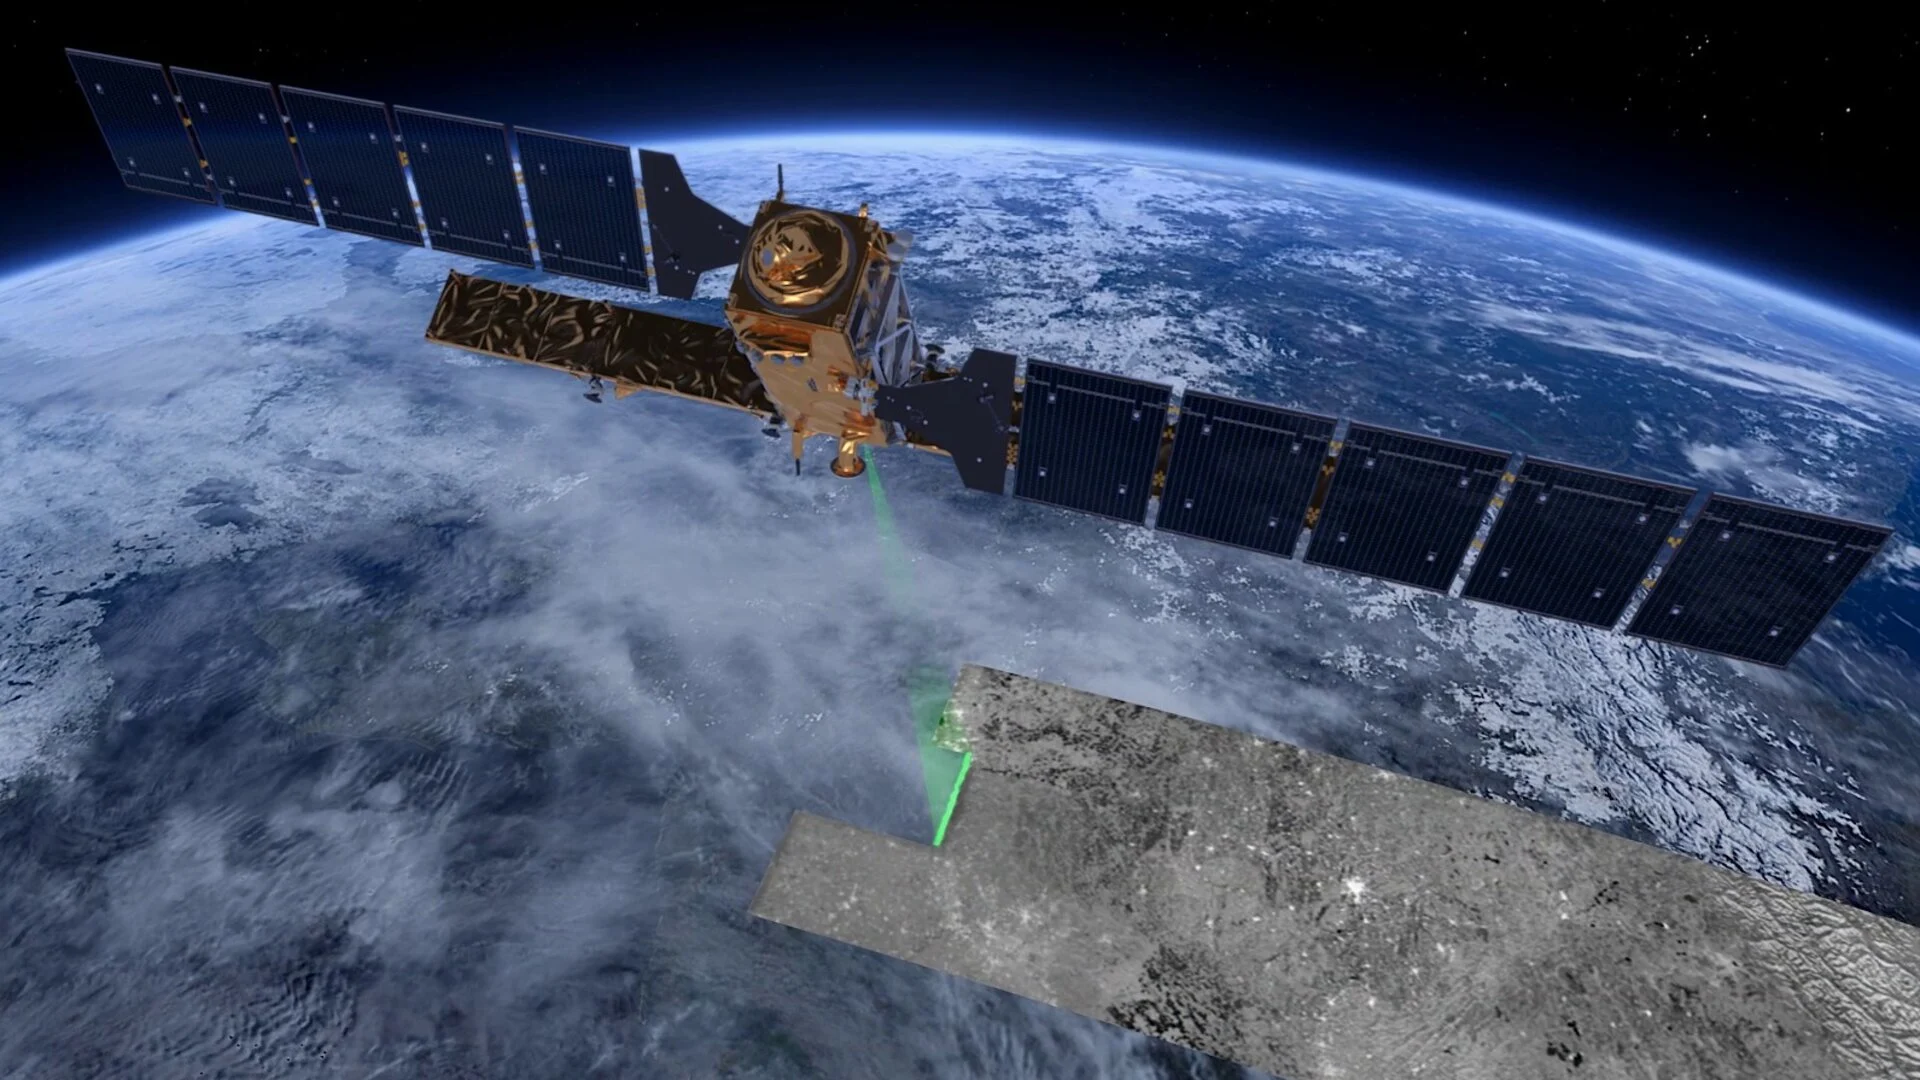
"Over the past three decades there's been a huge international effort to understand what's happening to individual components in Earth's ice system. This has been revolutionized by satellites as they allow us to routinely monitor the vast and inhospitable regions where ice can be found," Dr. Thomas Slater, the lead author of the study from the Centre for Polar Observation and Modelling at the University of Leeds in the UK, said in a European Space Agency press release.
This new research, published in the journal The Cryosphere, shows that the rate of ice loss around the world has been gradually increasing, from 800 billion metric tons each year in the 1990s, to 1.3 trillion metric tons per year in 2017. That's more than a 62 per cent increase in the rate of melting in just that short amount of time.

In this artist's conception drawing, a 10km x 10km x 10km block of ice looms over New York City, representing just 1 trillion metric tons of ice. A total of 28 of these massive blocks would equal roughly the amount of ice Earth lost to global warming between 1994 and 2017. Credit: ESA/Planetary Visions
"The ice sheets are now following the worst-case climate warming scenarios set out by the Intergovernmental Panel on Climate Change," Slater told the ESA.
According to the study, over the 23 years of the survey, the biggest losses were from Arctic sea ice (7.6 trillion metric tons), Antarctic ice shelves (6.5 trillion metric tons) and mountain glaciers (6.1 trillion metric tons). Losses from the Greenland ice sheet accounted for another 3.8 trillion metric tons, while the Antarctic ice sheet lost 2.5 trillion metric tons. The sea ice in the Southern Ocean, surrounding Antarctica, amounts to 900 billion metric tons.
Watch below: NASA scientist explains 2020's place in the climate record
All of this ice loss is having an impact on sea level rise. Much of the current sea level rise we've experienced so far has come from ice sheets and glaciers on land. As these melt, the water pours into the oceans, adding to their volume. Ice shelves and sea ice play a lesser role, by affecting how much of sunlight the oceans absorb.
"Sea-ice loss doesn't contribute directly to sea-level rise, but it does have an indirect influence. One of the key roles of Arctic sea ice is to reflect solar radiation back into space, which helps keep the Arctic cool," study co-author Isobel Lawrence, a research fellow at the Centre for Polar Observation and Modelling, told the ESA. "As the sea ice shrinks, more solar energy is being absorbed by the oceans and atmosphere, causing the Arctic to warm faster than anywhere else on the planet."
According to the latest assessments, the National Oceanic and Atmospheric Administration (NOAA) says that sea levels have risen by around 21-24 centimetres since 1880. 6.6 centimetres of that sea level rise has occurred just in the past 20 years.
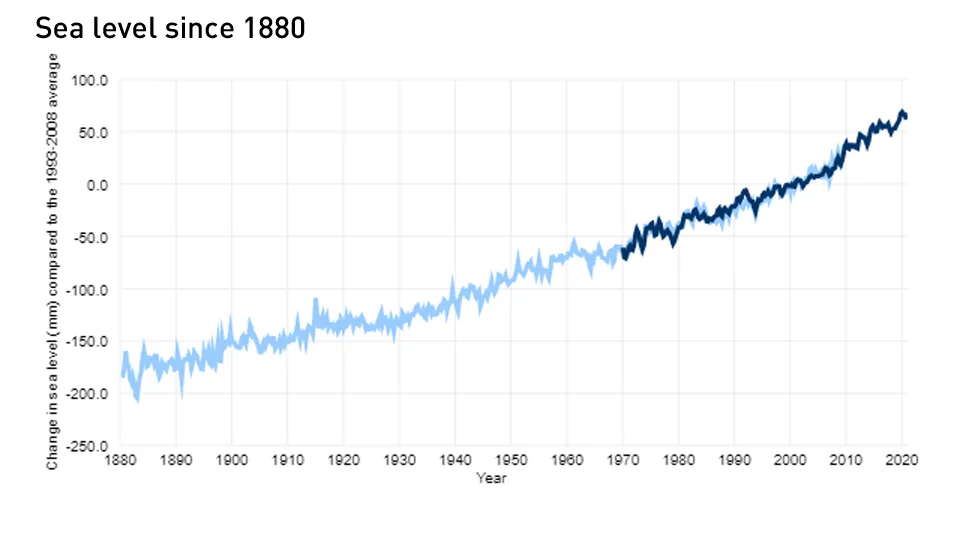
Sea levels from 1880 to 2020 shows that Earth’s oceans have risen by 21-24 cm in the past 140 years, with the rate of change from 2018-2019 being 6.1 millimetres. The light blue line shows seasonal (3-month) sea level estimates from a 2011 study. The darker line is based on University of Hawaii Fast Delivery sea level data. Credit: NOAA/climate.gov
Based on projections, if we continue on our current path of emitting greater and greater amounts of greenhouse gases—the 'business as usual' trajectory—by the year 2100, sea levels could rise as much as 2.5 metres above those seen in the year 2000. If we reduce emissions to a best-case scenario, sea levels are likely to still rise by another 30 centimetres by the end of the century.
The ESA says that, for each centimetre of sea-level rise that occurs, an estimated 1 million people in low-lying regions of the world are put in danger of being displaced from their homes.