
Sun worshipers will hate these southern Ontario sky stats
If you've been disappointed with spring 2019, you've got a good reason.
After a long, grey winter, southern Ontarians were overjoyed when Groundhog Weather Celebrity Wiarton Willy emerged to cloudy skies and didn't see his shadow, suggesting an early spring. But there's one thing we didn't count on -- none of us would be seeing our shadows in the gloomy months ahead, either.
Start planning for the season ahead with our Complete Guide to Summer 2019
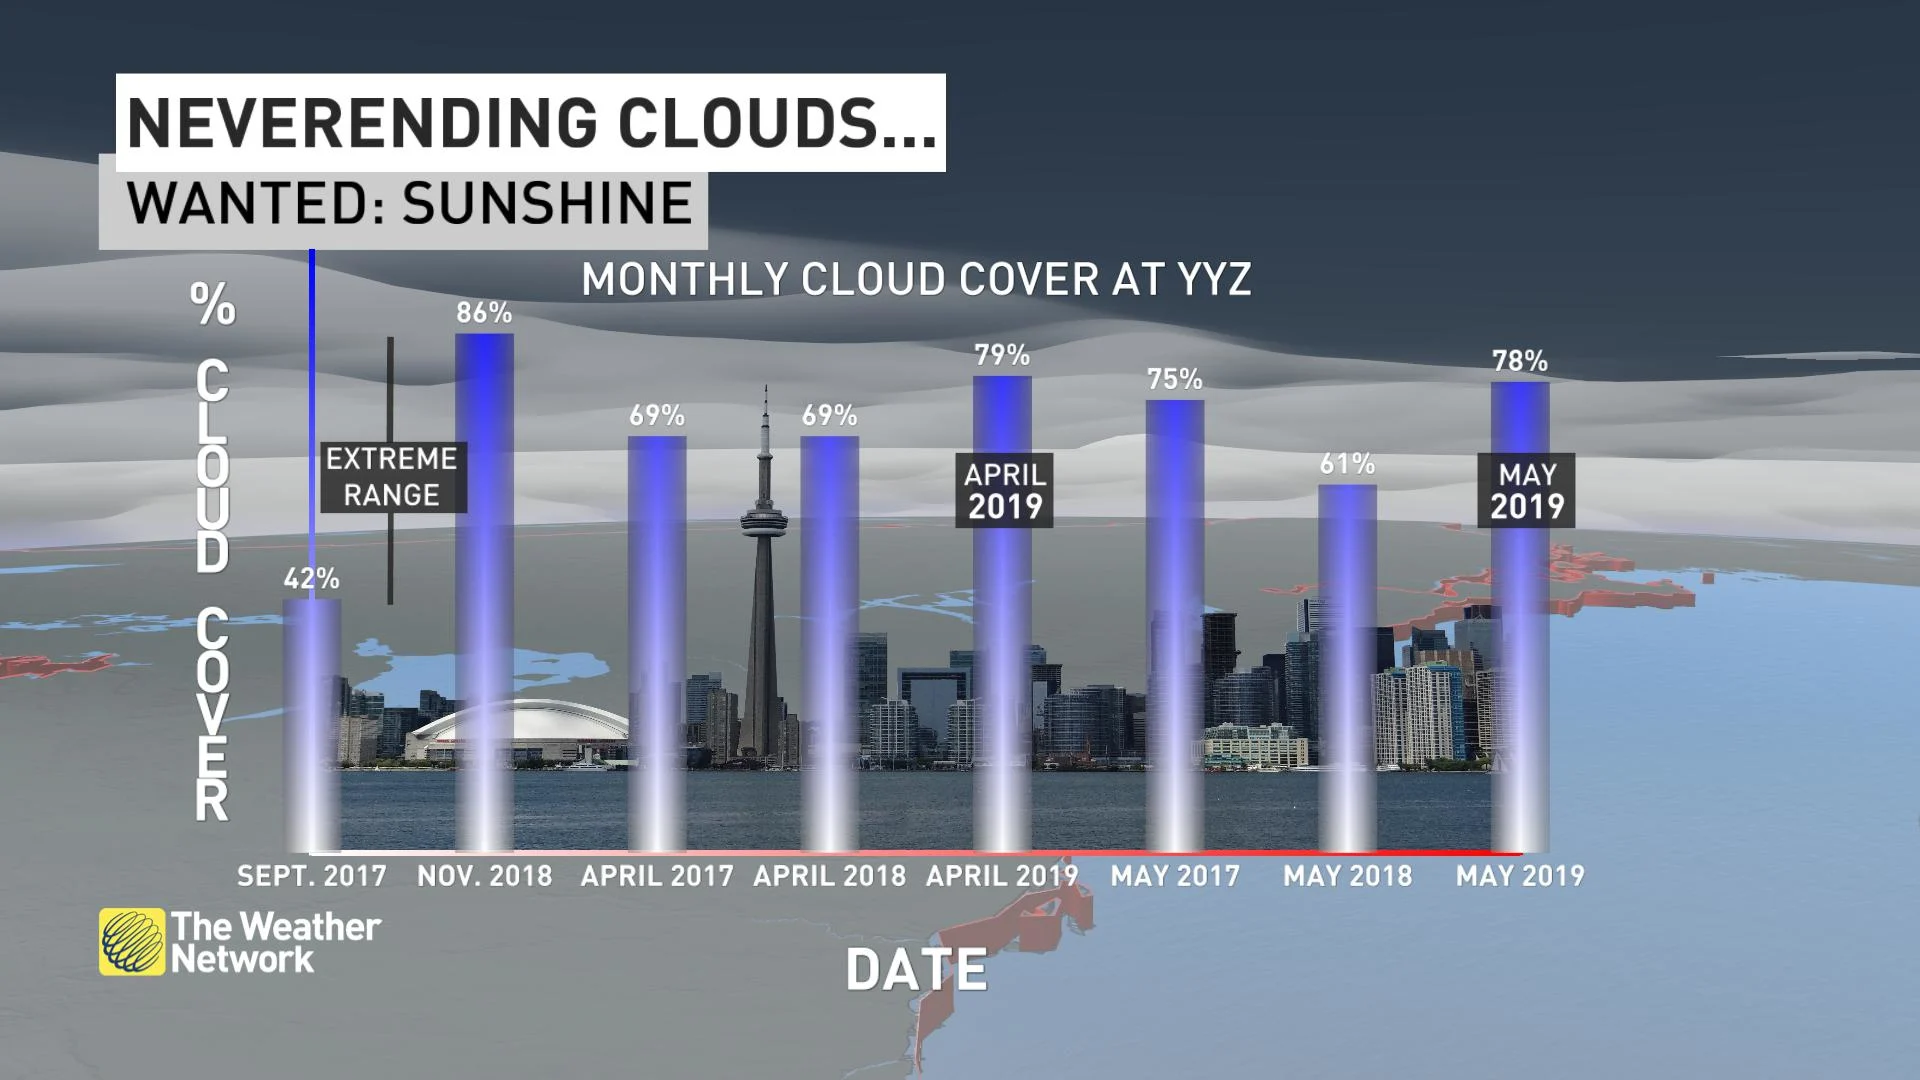
The stats are in for April and the first half of May, however, and it's official; the start to spring has been unusually cloudy across the region.
For weather purposes, the amount of cloud cover in the sky at any given time is recorded in a unit known as oktas. As the name implies, an observer mentally divides the sky above into eights, like a pie, and determines how many of those slices are cloudy. A zero means bright sunny skies, while an eight out of eight indicates overcast conditions.

An example of 3 to 4 oktas of cloud cover, or scattered clouds. Image courtesy Getty Images.
One of the cloudiest months on record in Toronto was the infamous November of 2018, where the sky averaged 6.9/8 oktas for the month, making it the cloudiest month on record for the city.

Meanwhile, in Toronto... Image courtesy Getty Images.
RELATED: Sun-starved November sets record
While April and May haven't been as cloudy as grey November, they've been giving the month a run for its money. April 2019 skies averaged 6.3/8 oktas at Toronto's Pearson International Airport, while May has thus far averaged 6.2/8 -- both in the 'broken skies' category.
By way of comparison, April 2017 and 2018 both averaged about 5.5, while May 2017 came in at 6.0, and May of last year was 4.9. To be fair, those values, too, fall in the realm of broken skies, but keep in mind those are average amounts for the entire month. Lower numbers mean there were more frequent or longer spells of sunshine (or clear nights), while higher numbers indicate prolonged periods of grey.
WHAT'S UP WITH OUR SKIES?
So what's behind southern Ontario's lack of sunshine?
It all comes down to the upper-level atmospheric pattern that's been in place over the eastern half of the continent for much of the spring -- in particular, the prevalence of a trough of low pressure slumping down over the Great Lakes and east coast.

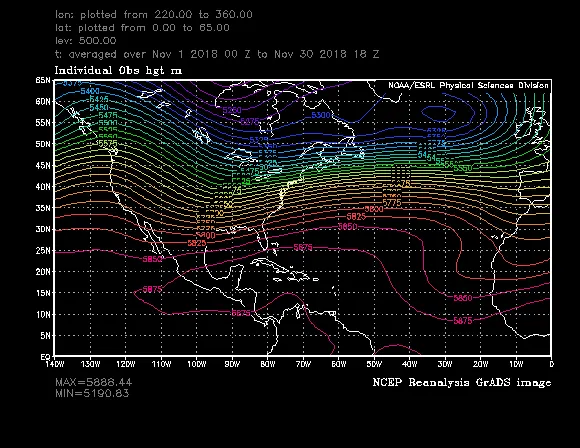
The image above shows the average pressure pattern over the continent from March to end of April and illustrate the trough dipping down over the east (the cooler colours bulging down over the region).
Compare that with November 2018's pattern and you'll see the same 'troughiness' that made that month one of our cloudiest:
SEE ALSO: What's the cause of this bizarre cloud formation in central Ontario?
Now compare those with the pattern from one of southern Ontario's sunniest months on record -- September 2017 -- and you see a much different pattern that signals sunny skies.
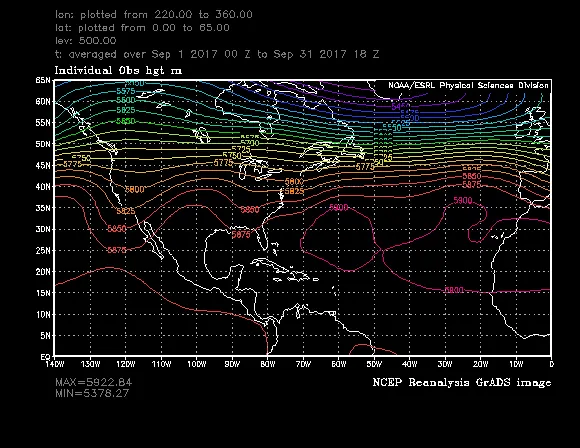
In this pattern, the bulge of warmer colours up over the Great Lakes indicates a ridge of higher pressure, which usually translates to dry weather and clear skies. And that's just what happened in that sunny September when sky cover in Toronto averaged only 3.4 oktas for the month.
Those sparkling skies came at a price, however.
WHY TORONTO'S SUNNIEST MONTH HAS A DARK SIDE
While southern Ontario basked in the summer sun for much of September 2017, the high pressure responsible for our good weather was also directing traffic, so to speak, when it came to hurricane season further south.
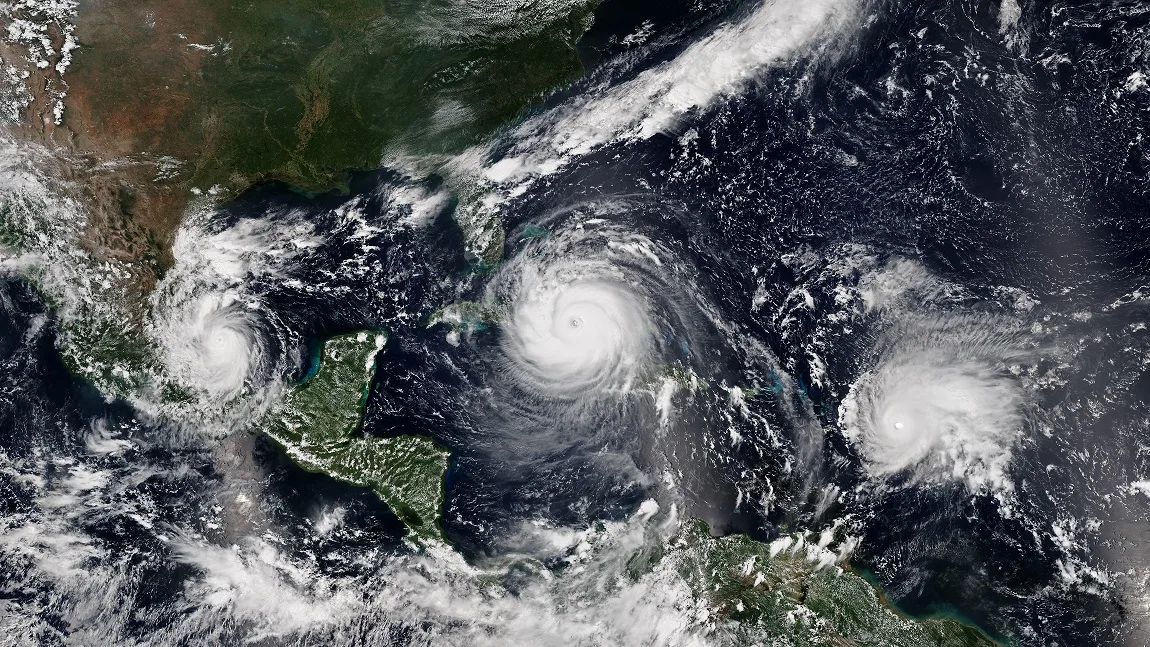
Hurricanes Katia, Irma, and Jose lined up across the Caribbean on September 8, 2017. Image courtesy NOAA.
The month featured four Category 4 or 5 hurricanes, including infamous storms Harvey, Irma, and Maria, all of which went on to do massive damage to parts of the Caribbean and the United States.