Ocean heatwave causing world's third coral bleaching event
Meteorologist/Science Writer
Thursday, October 8, 2015, 1:51 PM - Coral reefs face the risk of a massive die-off due to extreme ocean heat, the "Hockey Stick" graph stands up against time and critics, and Scottish scientists turn whiskey waste into biofuel. It's What's Up In Climate Change.
Third global coral bleaching event under way
NOAA - the US National Oceanic and Atmospheric Administration - just announced the third global coral bleaching event on record is now under way, due to the effects of climate change and the soaring ocean temperatures in the Pacific from El Niño.
"The coral bleaching and disease, brought on by climate change and coupled with events like the current El Niño, are the largest and most pervasive threats to coral reefs around the world," Mark Eakin, NOAA’s Coral Reef Watch coordinator, said in a statement on Thursday. "As a result, we are losing huge areas of coral across the U.S., as well as internationally. What really has us concerned is this event has been going on for more than a year and our preliminary model projections indicate it’s likely to last well into 2016."

Global coral bleach stress levels since July 2015. Credit: coralreefwatch.noaa.gov
According to NOAA:
This bleaching event, which began in the north Pacific in summer 2014 and expanded to the south Pacific and Indian oceans in 2015, is hitting U.S. coral reefs disproportionately hard. NOAA estimates that by the end of 2015, almost 95 percent of U.S. coral reefs will have been exposed to ocean conditions that can cause corals to bleach.
The biggest risk right now is to the Hawaiian Islands, where bleaching is intensifying and is expected to continue for at least another month. Areas at risk in the Caribbean in coming weeks include Haiti, the Dominican Republic and Puerto Rico, and from the U.S. Virgin Islands south into the Leeward and Windward islands.
The next concern is the further impact of the strong El Niño, which climate models indicates will cause bleaching in the Indian and southeastern Pacific Oceans after the new year. This may cause bleaching to spread globally again in 2016.

Credit: NOAA
As Richard Vevers, Executive Director of the XL Catlin Seaview Survey, says in the video above, coral reefs can recover from bleaching events given the right conditions. However, if the corals are subjected to these kinds of events repeatedly, in quick succession, recovery will become impossible and the corals will die off.
Given that NOAA identifies coral reefs as "some of the most diverse and valuable ecosystems on Earth," such a die-off would be very bad news for the health of our oceans, bad news for us in turn.
"Hockey Stick" graph is validated, yet again
Just before the turn of the century, Michael E. Mann and Raymond S. Bradley, then at the University of Massachusetts, and Malcolm K. Hughes of the University of Arizona - Tucson, introduced the world to the "Hockey Stick" graph.
This graph reconstructed centuries of northern hemisphere temperatures from proxy sources - corals, tree rings, ice cores and sediment layers - and connected that data to modern temperature records from weather stations. In the end, the shape of the graph - a characteristic hockey-stick like curve - showed that global temperatures had been relatively stable (although cooling slightly) for hundreds of years, and then took a sharp uptick around the start of the Industrial Revolution. Thus, it revealed the dramatic effect that humans are having on Earth's climate due to our use of fossil fuels.
Although repeatedly challenged by critics since, in an attempt to discredit both the science behind it and the scientists who produced it, the graph has been validated again and again by the scientific community, and now it has been verified by yet another study.
The PAGES 2k project, a 7-year international effort that involved 78 researchers from 24 countries around the world, brought together the data from over 500 different climate archives to produce a new temperature graph for the past 2,000 years.
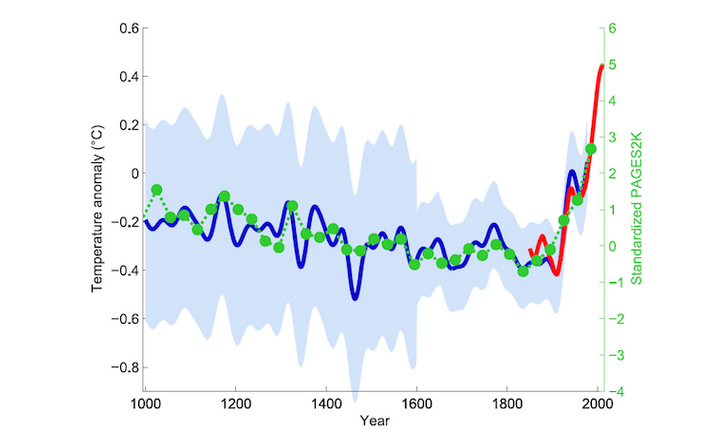
Mann, Bradley and Hughes (1999) data are shown via the blue line, with the light blue area representing the data's uncertainty. HadCRUT4 data, from the UK Met Office and University of East Anglia, plotting temperatures from 1850 to present day, are represented via the red line. The new PAGES 2k project data 30-year averages are plotted via the green dots. Graph by Klaus Bitterman, via ThinkProgress and Scilogs.de.
Climatologist Stefan Rahmstorf, of the Potsdam Institute for Climate Impact Research, wrote on Scilogs.de (translated for Think Progress):
For the scientific community, the confirmation of the old hockey stick is no surprise (except perhaps for the closeness of the match); many other climate reconstructions with a similar time evolution have already appeared since. Mann et al. at the time cautiously assumed a wide margin of uncertainty (light blue) because of their limited data base and a possible underestimation of the variance by their method; later reconstructions run largely within this margin.
Scottish plant to produce biofuel from whiskey waste
Biofuels are one of the ways that we can kick the fossil fuel habit, and thus mitigate the effects of climate change, and UK-based Celtic Renewables has set in motion a plan to produce renewable fuels using the waste products that come from distilling whiskey.
Although this plan was announced just over two years ago, the UK government just awarded the company £11 million (the equivalent of $21.95 million Canadian), to build a plant near Grangemouth, roughly 25 km northwest of Edinbugh.
Sources: NOAA News | NOAA Ocean Service Education | Think Progress | Scilogs.de (in German) | Think Progress | Celtic Renewables